
Introduction
One day you waked up and decided to solve all the issue in your plants -which is a good thing to do in the morning- you opened the production system and sort out all the big issues, you found out that there are many of these issues, so the next logical step is to select the biggest one of these many issues. One of the ways to do that is a Pareto chart, where we want to find the 20% of the causes that create the 80 of the effect -losses in our case- I’ll claim that there are better ways to find and visualize the bad actors, but first let’s try the Pareto chart.
The Data
Our data contains 129 observations (incidents) the first 15 rows looks like this:-
| Incident ID | Start Date | Plant | Cost | Category | Type | Lost Production | Asset |
|---|---|---|---|---|---|---|---|
| 1 | 2017-01-14 | P5 | 124980 | Equipment | Instrument | 421 | FV-1111 |
| 2 | 2017-01-27 | P3 | 14010 | Equipment | Mechanical - Rotating | 58 | K-1111 |
| 3 | 2017-01-30 | P3 | 157313 | Equipment | Instrument | 768 | HV-1111 |
| 4 | 2017-02-02 | P1 | 6196 | Process | Preparation for Planned Shutdown | 14 | NA |
| 5 | 2017-02-03 | P5 | 151692 | Equipment | Instrument | 512 | PV-1234 |
| 6 | 2017-02-03 | P1 | 16157 | Process | Preparation for Planned Shutdown | 49 | NA |
| 7 | 2017-02-04 | P5 | 245393 | Process | Preparation for Planned Shutdown | 834 | NA |
| 8 | 2017-02-05 | P4 | 16969 | Process | Preparation for Planned Shutdown | 102 | NA |
| 9 | 2017-02-06 | P3 | 40073 | Process | Preparation for Planned Shutdown | 187 | NA |
| 10 | 2017-02-06 | P4 | 39381 | Process | Preparation for Planned Shutdown | 259 | NA |
| 11 | 2017-02-28 | P3 | 152990 | Process | Plant Start up | 807 | NA |
| 12 | 2017-03-01 | P3 | 119481 | Process | Plant Start up | 627 | NA |
| 13 | 2017-03-02 | P5 | 1299618 | Equipment | Mechanical - Stationary | 3849 | V-1201 |
| 14 | 2017-03-02 | P3 | 146653 | Equipment | Process Control | 773 | PV-2222 |
| 15 | 2017-03-03 | P5 | 1299618 | Equipment | Mechanical - Rotating | 3849 | C-1100 |
you may have different taxonomy and different level of details where you work but the concept still the same, however when it comes to the details, the more the merrier.
Pareto Chart
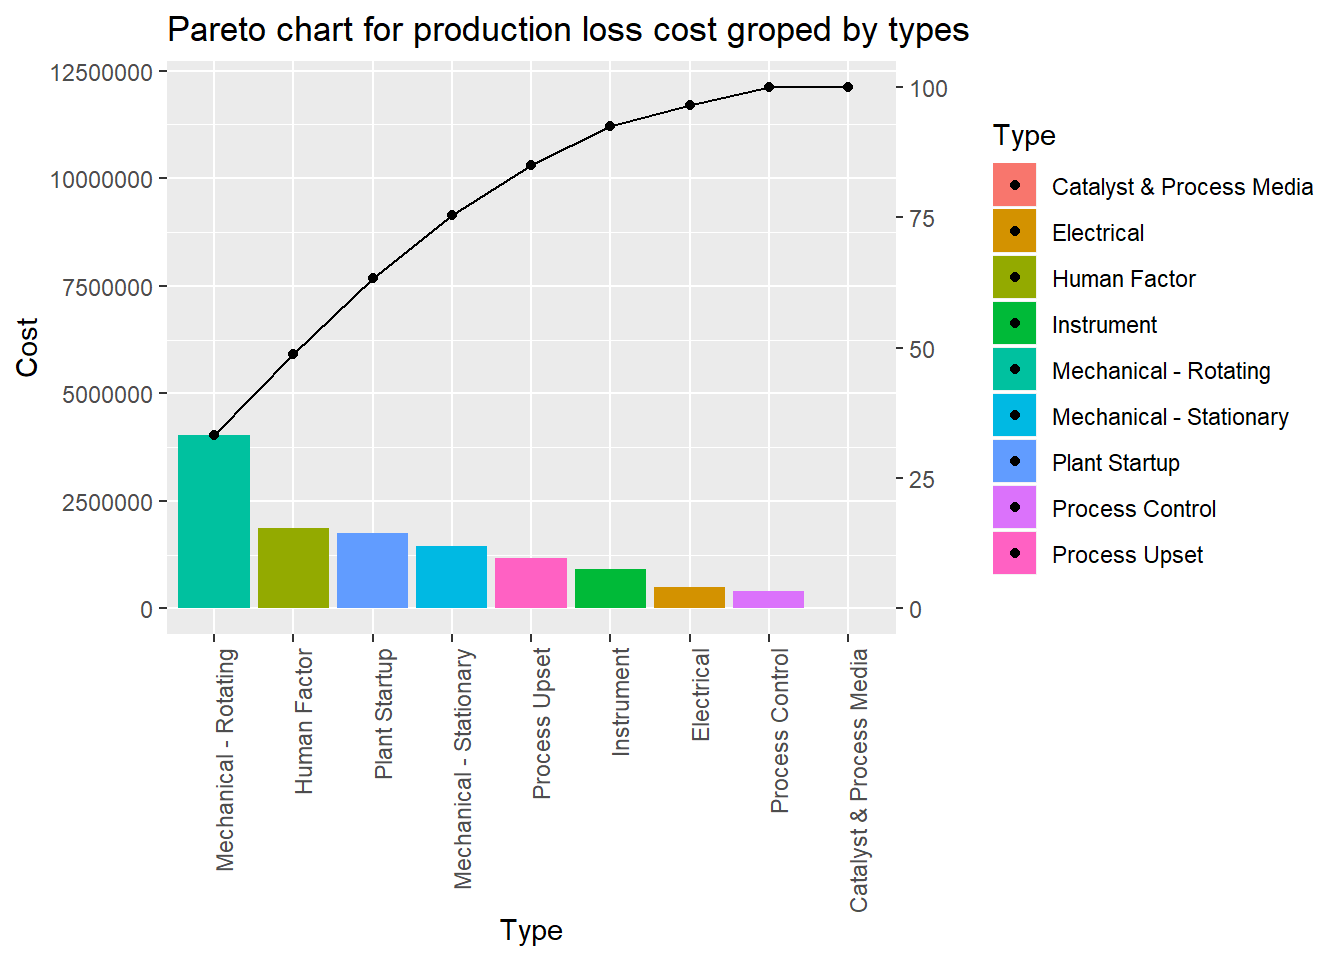
The first question comes to the mind when we want to do Pareto chart is “group by what ?”. In our case, we have 8 columns, 6 causes and 2 effects(i.e. cost and lost production). so we’ll group by which cause and which effect? which of these effects is more important? I think the answer is very clear for this one.bottom line it’s the cost $. But what about the causes? the “Incident ID” is very small, “Plant” might be very big, the choice of the right level of “data granularity” might be choose based on the frequency of the report, so we might found large granular suitable for yearly report and fine granular more suitable for weekly or monthly reports, however in the second approach of visualizing the bad actors we don’t need to worry about this issue, we’ll see that shortly. Now and for this Pareto example I’ll group by “Type”.
Sunburst Chart
Sunburst chart looks very confusing at the first time but once you give it a chance you’ll love it. You can summarize a lot of data at a glance.
First, we need to make our data in the following format.
| con | Cost |
|---|---|
| P1-Equipment-Mechanical - Rotating-P3423 | 6051 |
| P1-Equipment-Mechanical - Rotating-P3659A | 4062 |
| P1-Process-Catalyst & Process Media-NA | 16101 |
| P1-Process-Plant Startup-NA | 1132052 |
| P1-Process-Preparation for Planned Shutdown-NA | 22353 |
| P1-Process-Process Upset-A3635A | 11450 |
| P1-Process-Process Upset-C3620 | 6217 |
| P1-Process-Process Upset-V3651 | 40381 |
| P1-Process-Process Upset-V3653 | 16209 |
We can eaisly format our data in this way using the code provided at “The code” section
The code
library(sunburstR)
library(dplyr)
production$Asset<- gsub("-","",production$Asset)
production$con <- paste(production$Plant,production$Category,production$Type,production$Asset,sep = "-")
keep <- c("Cost", "con")
production2 <- production[keep]
production2 <- production2[c(2,1)]
production2 <- production2 %>% group_by(con) %>% summarise(Cost =sum(Cost))
sunburst(production2, count = T)
Path forward
After we have identified the Bad Actors, it’s time to take action, now we’ll go from problem identification to problem-solving. The Root Cause Analysis (RCA) is an excellent tool to address high-level problems like the bad actors. For more about the RCA:-
Additional Reading
The additional reading focus on the practice of identifying the “Top issues”:-
Note: I’m not affiliated with linked organizations, references made based on my experience as end-user.